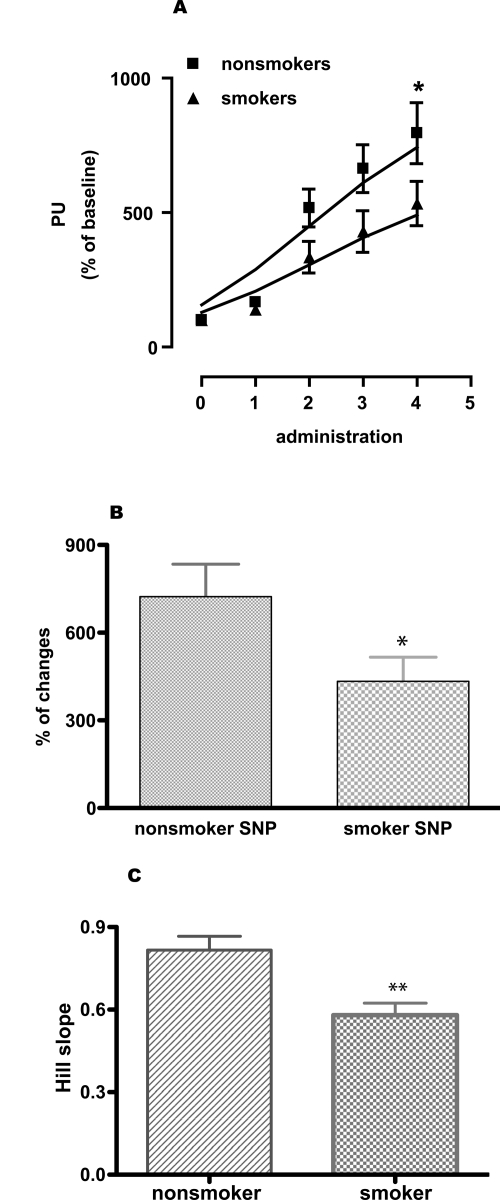
Figure 4.
Skin blood flow changes (percent of perfusion units). (A) Local heating (44 °C)-induced relaxation (given as perfusion unit) of microcirculation in nonsmokers matched with smokers and (B) percent changes of microcirculation in response to heating in nonsmokers and smokers. Two-way ANOVA with Bonferroni post-test for comparing response lines. A two-tailed, unpaired Student’s t-test with Welch’s correction was used to compare percent changes of the response between non smokers and smokers. Values are given as mean ± s.e.m. (n = 17, p < 0.001).

