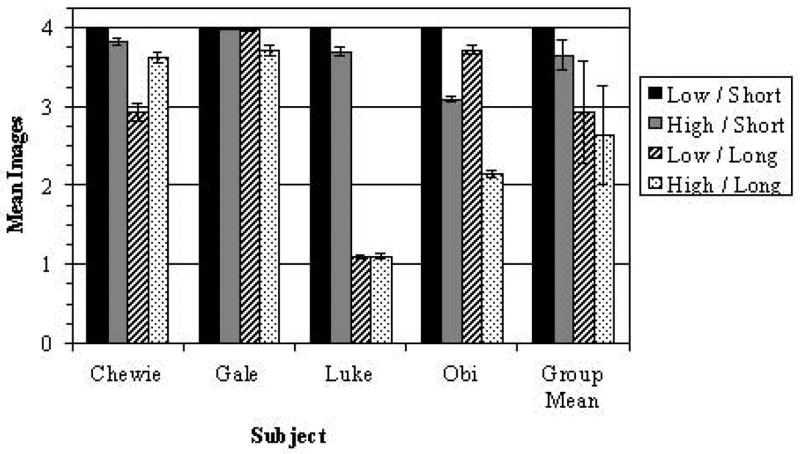
Figure 3.

Mean number of images selected before “cashing-out” in each condition of Experiment 2. Bar height represents mean image selection, bar color represents experimental condition, and error bars represent the standard error of the mean. Bars are clustered by individual, and a final cluster is provided to represent the mean performance of the entire group.
