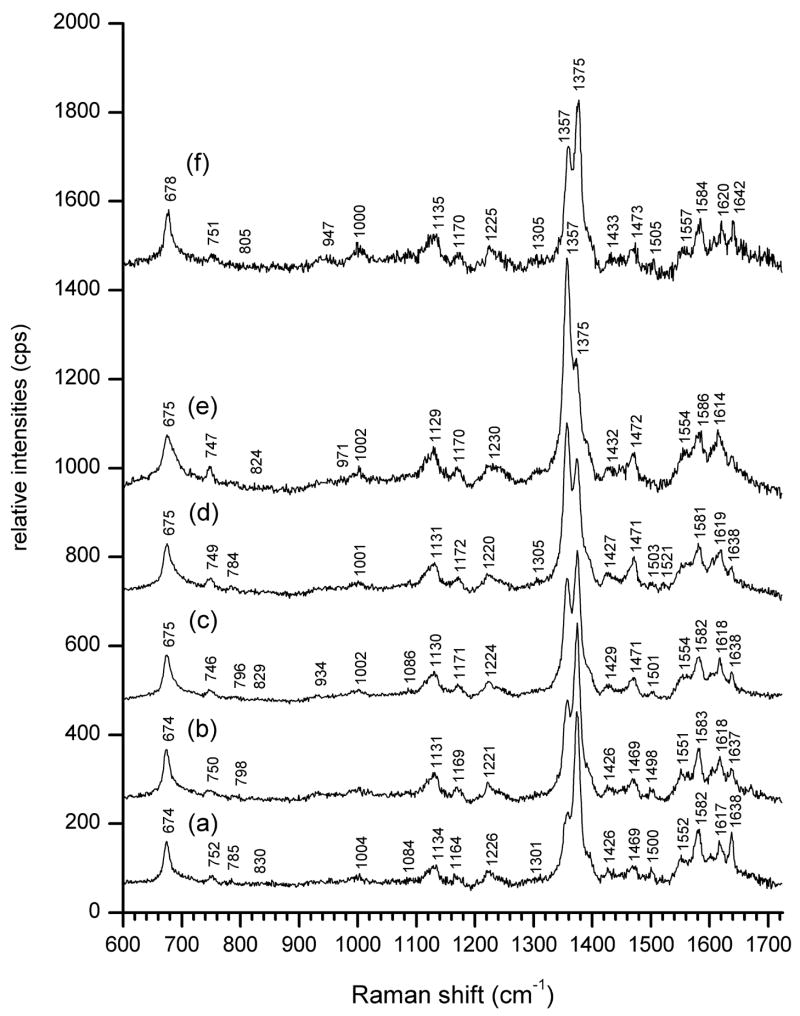
Figure 2. Resonance Raman spectra (5 mw 406.7 nm excitation, 30 sec accumulation) of a rat sublingual surface during controlled hemorrhage and resuscitation. Central venous saturations (ScvO2) were determined by co-oximetry. The traces are offset along the vertical intensity scale for clarity.
(a) Pre-hemorrhage baseline. ScvO2 = 0.811
(b) - (e) Progressive hemorrhage in terms of increments of total blood volume (TBV): (b) 10% TBV (2.24 ml), ScvO2 = 0.789, (c) 20% TBV (4.48 ml), ScvO2 = 0.546, (d) 25 % TBV (5.60 ml), ScvO2 = 0.463, e) 30% TBV (6.72 ml), ScvO2 = 0.379
(f) Resuscitation with 6.6 ml of previously withdrawn blood, ScvO2 = 0.628

