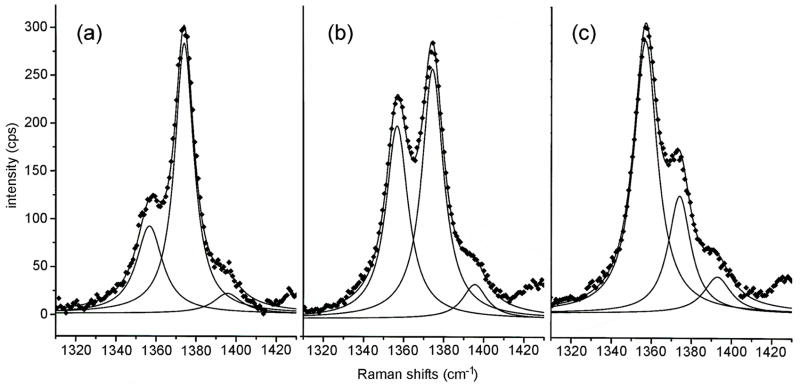
Figure 4.
Spectral deconvolution of representative resonance Raman traces (data from Figure 2).(a) pre-hemorrhage (b) 20% blood volume hemorrhage, and (c) 30% blood volume hemorrhage. The original data points are shown as diamonds ◆ Deconvolutions and their summations are represented by solid lines.

