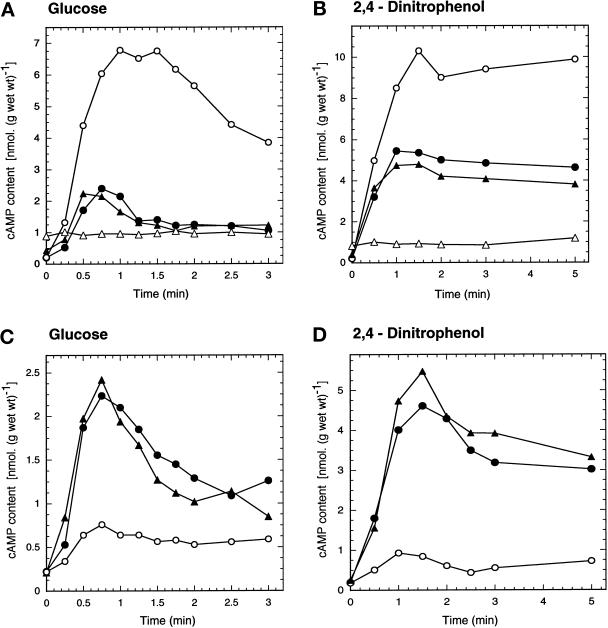
Figure 1.
Intracellular cAMP level as a function of time after addition of 100 mM glucose (A and C) or 2 mM 2,4-dinitrophenol (B and D). (A and B) Phosphodiesterase-deficient strains: wild-type strain (W303–1A) (•); pde1Δ strain (PM941) (○); pde2Δ strain (PM942) (▴); and pde1Δ pde2Δ strain (PM943) (▵). (C and D) Strains with overexpression of PDE1 or PDE2: wild-type strain + YEplac195 (PM850) (•); wild-type strain + YEpPDE1 (PM851) (○); wild-type strain + YEpPDE2 (PM852) (▴).

