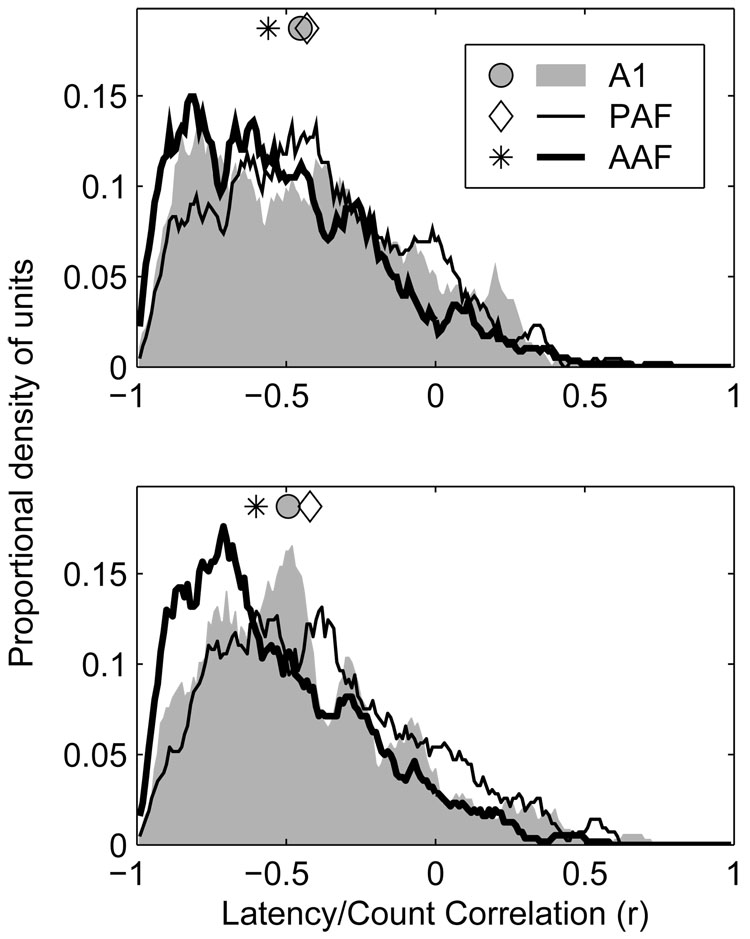
Figure 12.
Rate- and latency-based spatial representations are more highly correlated in AAF and A1, than in PAF. Plotted are distributions of correlation coefficients between rate- (RAF) and latency-azimuth functions (LAF) of units in each population at 20 (bottom) and 40 dB (top) above threshold. Symbols represent the median of each distribution.

