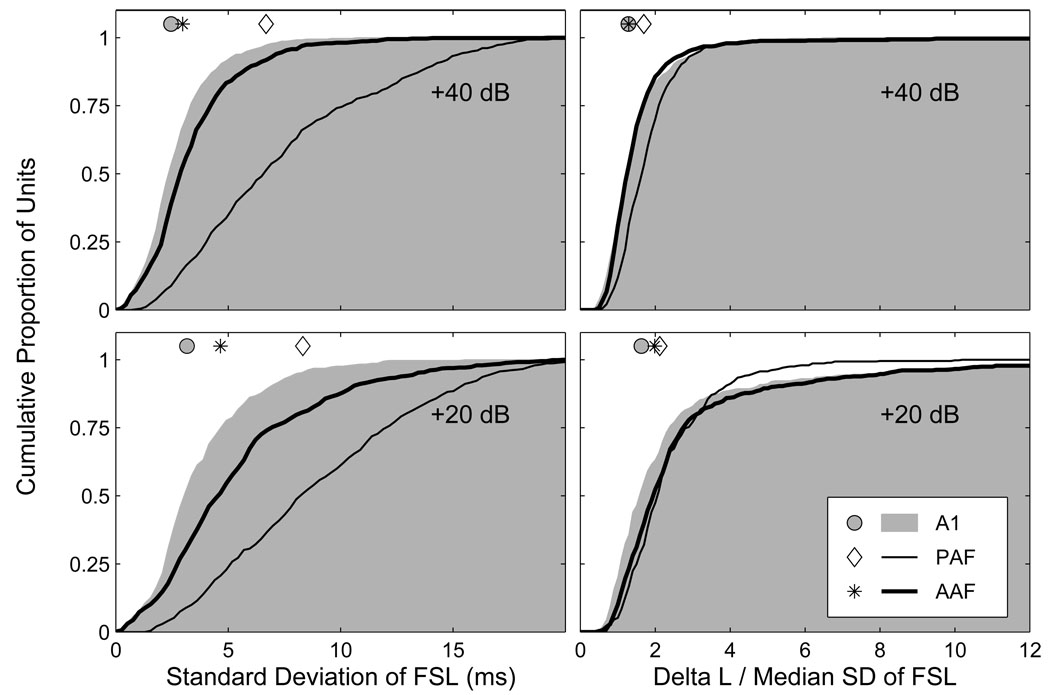
Figure 3.
Response latencies in AAF and A1 show less trial-to-trial variability than in PAF. Plotted on the left are cumulative distributions of the median standard deviation (SD) of first-spike latencies across all azimuths separately at 20 (bottom) and 40 dB (top) above threshold. There was a significant reduction in variability at the higher level in each field, with the smallest reduction in variability in A1, and the largest reduction in AAF. A1 had the least variable first-spike latencies, PAF the most. Symbols represent the median of each distribution. Plotted on the right are cumulative distributions of the ratio of ΔL to the median SD of FSLs across azimuth, a ratio that expresses the spatial modulation of response latencies as a proportion of the trial-to-trial variability of response latencies. The highest median ratio was observed in PAF, whereas the lowest median ratio was observed in AAF (AAF did not differ from PAF at the lower level or from A1 at the higher level).

