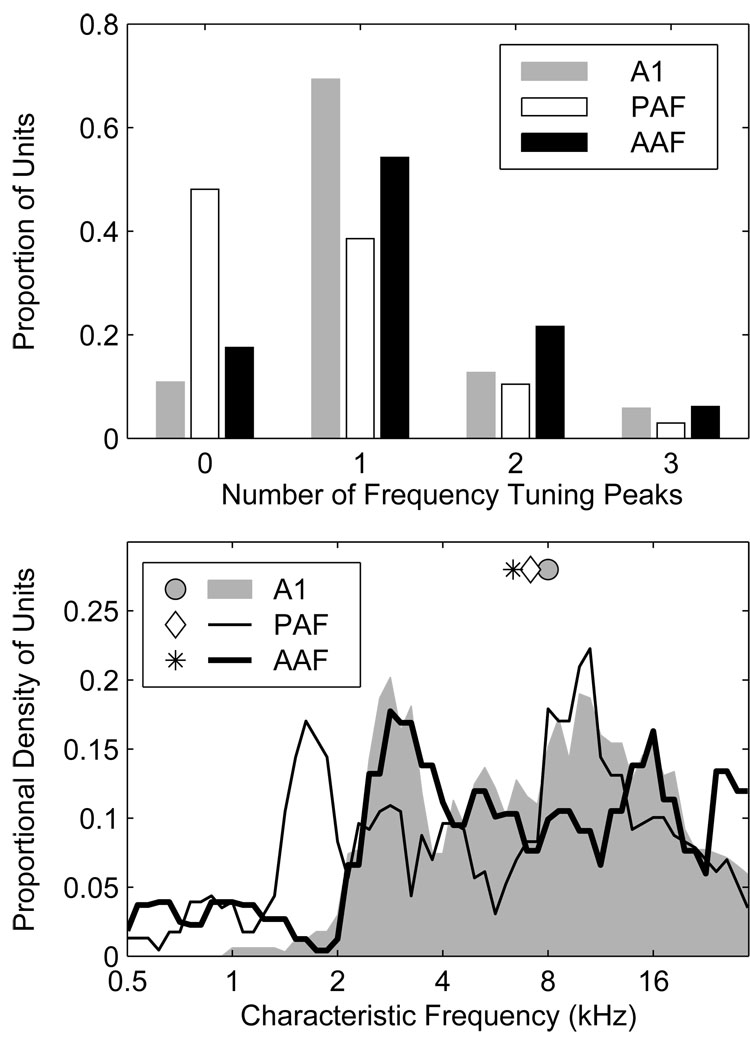
Figure 5.
A greater proportion of units in AAF and A1 have defined characteristic frequencies (CFs) than in PAF. A single CF defined the FRAs of most units, although multi-peaked FRAs were not uncommon, particularly in AAF. An example of a multi-peaked AAF unit can be seen in the middle panels of Figure 1. Top: the proportion of units with undefined CFs is indicated by the bars at Number of Peaks = 0. The other bars indicate the proportions of units having from 1 to 4 CFs. Bottom: distributions of primary CF (i.e., the CF with the lowest threshold), smoothed with a 0.5-octave-wide rectangular window. The slightly higher median CF in A1 is caused by an almost complete absence of A1 units with CFs below 2 kHz.

