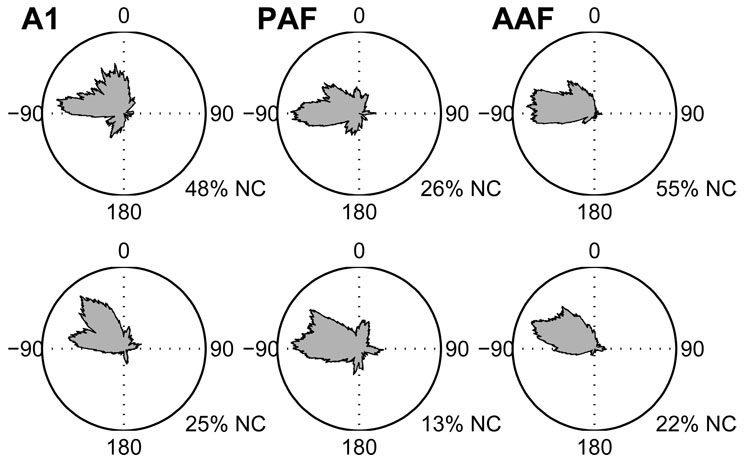
Figure 6.
Distributions of azimuth centroids for stimuli presented 20 (bottom) and 40 dB (top) above unit threshold. Distributions are plotted from an overhead perspective with 0° being directly in front of the animal, 180° being directly behind, and −90° and +90° indicating locations to the animal’s left and right, respectively. In each field, fewer units had defined centroids at 40 than 20 dB above threshold. The percentage of units with no centroid (NC) is given under each plot. Note, however, that whereas only 45 and 52% of AAF and A1 units had defined centroids at the higher SPL, respectively, 74% of PAF units did.

