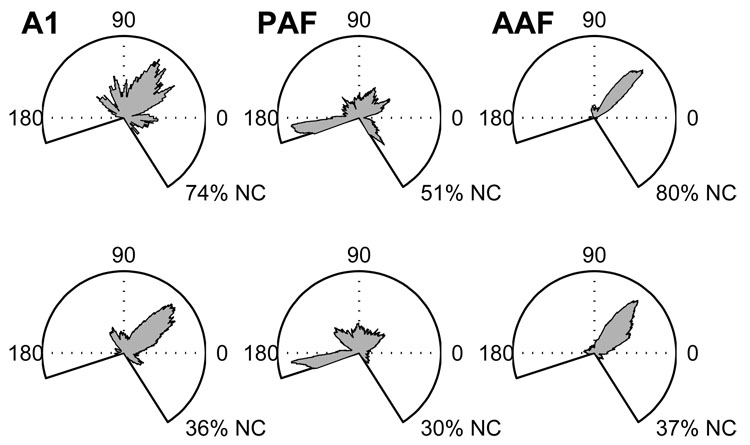
Figure 7.
Distributions of elevation centroids for stimuli presented 20 (bottom) and 40 dB (top) above unit threshold. In the elevation plots, the perspective is from the side with 0° being directly in front of the animal, 180° being directly behind, and +90° being directly above. Similar to the situation observed for azimuth centroids, only 20 and 26% of AAF and A1 units had defined centroids at the higher SPL, respectively, compared to 49% of PAF units. The percentage of units with no centroid (NC) is given under each plot.

