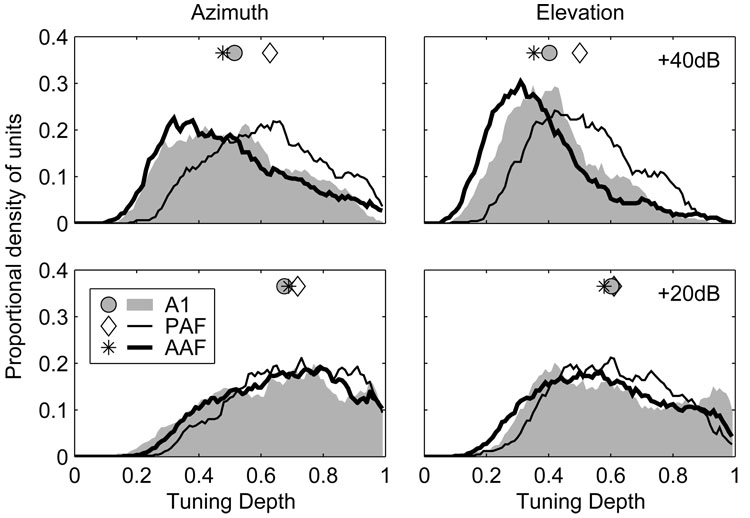
Figure 9.
Unit responses in AAF and A1 are less strongly modulated by changes in stimulus location than in PAF, particularly at higher stimulus levels. Plotted are distributions of spatial tuning depth in azimuth (left) and elevation (right) for stimuli presented 20 (bottom) and 40 dB (top) above threshold. Symbols represent the median of each distribution.

