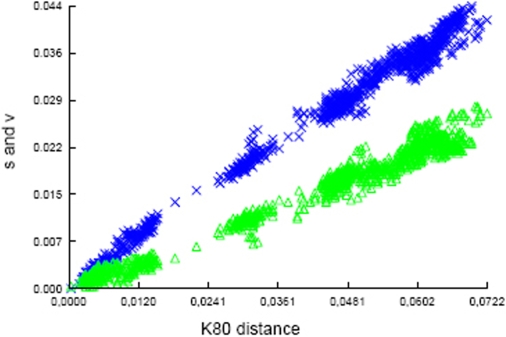
Figure 1. Transitions/transversion vs genetic distance.
From the six concatenated sequences used for phylogentic studies the transitions (blue crosses) and transversions (green triangles) are plotted against genetic distance according to the K80 model. No saturation is detected and the transitions/transversion ratio is estimated at 2.

