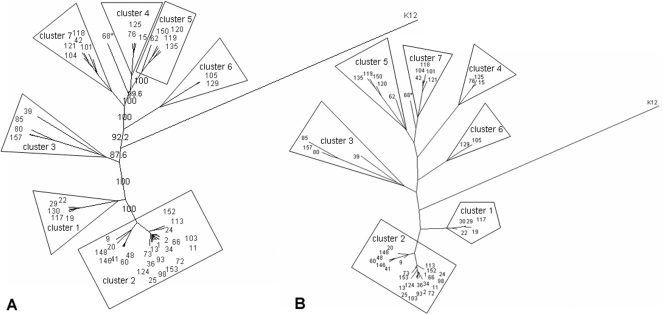
Figure 2. Phylogenetic trees of E. cloacae complex.
A) Phylogenetic tree based on results of MLSA clustered with Clonalframe. Numbers indicate confidence values of the branches. * Solitaire isolate. K12: E. coli K12 used as the outgroup. B) Phylogenetic tree based on concatenated sequences of six gene fragments clustered with the Maximum Likelihood. Each color depicts a cluster according to the CGH results. * Solitaire isolate. K12: E. coli K12 used as the outgroup.

