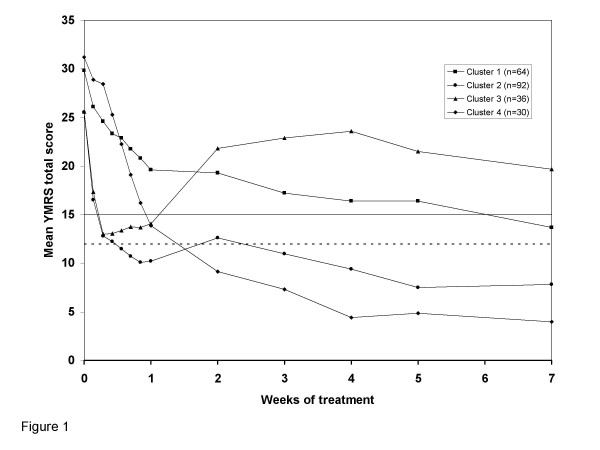
Figure 1.
Response profiles of clusters. Cluster 1, slow responders who subsequently relapsed. Cluster 2, early symptom improvement in patients who achieved sustained remission. Cluster 3, early symptom improvement in patients who subsequently relapsed. Cluster 4, slow responders who subsequently remitted. The horizontal solid line represents the threshold for relapse (YMRS total score of 15), and the horizontal dashed line represents the threshold for remission (YMRS total score of 12).

