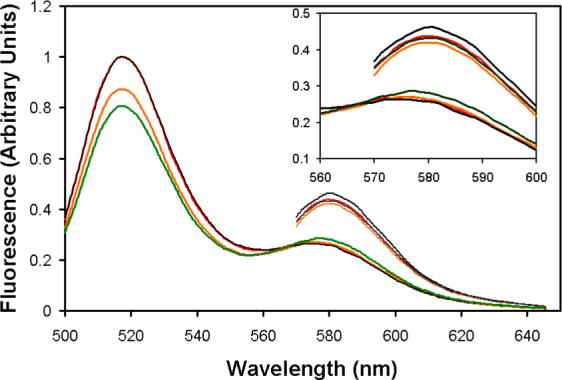
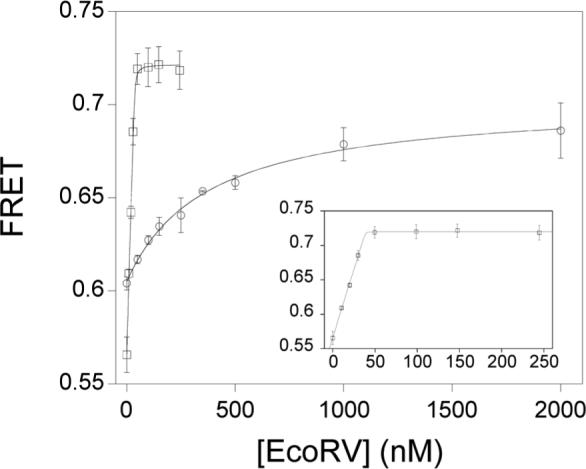
Figure 3. Equilibrium FRET titrations.


A) Steady-state emission scans. Excitations at 485 nm produce the 520 nm fluorescein emission peak, which is decreased by resonance energy transfer to tetramethylrhodamine. Excitations at 555 nm produce the 580 nm peak. Black trace: 25 nM doubly-labeled DNA; green trace: 25 nM doubly-labeled DNA in the presence of 50 nM wild-type EcoRV; red trace: 25 nM doubly-labeled DNA; orange trace: 25 nM doubly-labeled DNA in the presence of 1μM EcoRVΔC. The inset is an expansion of the scans around the 580 nm tetramethylrhodamine acceptor peak. B) A constant amount of labeled DNA was incubated with increasing concentrations of WT (squares) or EcoRVΔC (circles) and the change in FRET was monitored. Note that the asymptote for EcoRVΔC is substantially lower than for WT. Inset: Expansion of the ordinate for the wild-type enzyme showing stoichiometric binding. The concentration of the DNA used is 25 nM.
