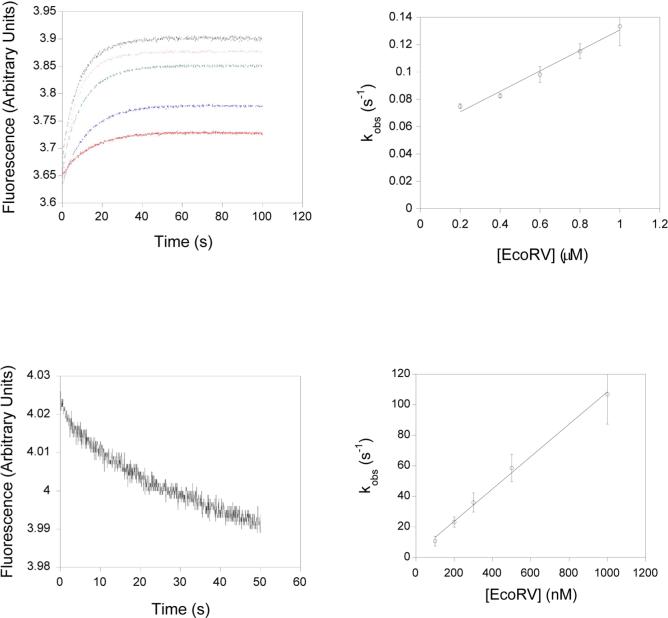
Figure 4. Association and dissociation kinetics of EcoRVΔC.
A) Upper left: Stopped flow time courses monitoring FRET. Varying concentrations of EcoRVΔC and labeled DNA were mixed and the change in acceptor fluorescence was monitored: red, blue, green, grey, and purple curves represent 200 nM, 400 nM, 600 nM, 800 nM and 1 μM EcoRVΔC, respectively. B) Upper right: Concentration dependence of the observed rates determined in (A). C) Lower left: Substrate trapping. Preincubated EcoRVΔC and labeled substrate were mixed with an excess of unlabeled DNA and the change in fluorescence was monitored. D) Lower right: Concentration dependence of the DNA bending rate for wild-type EcoRV. The intercept very near the origin reflects the very tight binding in this case.

