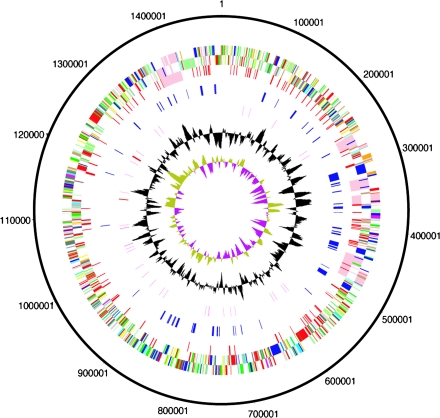
FIG. 1.—
Circular representations of the genome of Wolbachia pipientis. The circles represent from the outside in: 1 + 2, all genes (transcribed clockwise and counterclockwise); 3, mobile elements (pink: prophage, red: IS elements); 4, ankyrin repeat genes (blue); 5, RNA genes (red: rRNAs, purple: tRNAs); 6, G + C content (plotted using a 10-kb window); 7, GC deviation ([G − C]/[G + C] plotted using a 10-kb window; khaki indicates values >1, purple <1). Color coding for genes in circles 1 + 2: dark blue, cell processes/adaptation/pathogenicity; black, energy metabolism; red, information transfer; dark green, surface associated; cyan, degradation of large molecules; magenta, degradation of small molecules; yellow, central/intermediary metabolism; pale green, unknown; pale blue, regulators; orange, conserved hypothetical; brown, pseudogenes; pink, mobile elements; and gray, miscellaneous.

