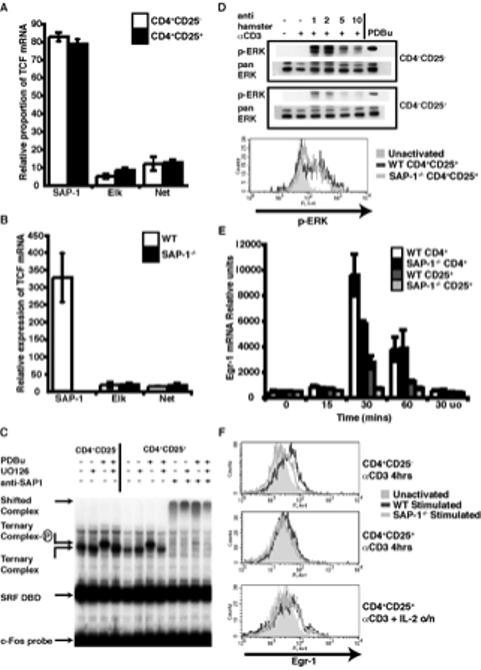
Figure 3. TCFs are expressed in Tregs but responses to TCR stimulus are reduced.

(A) Relative contribution of the three TCF mRNAs in thymic Tregs compared with conventional CD4+ thymocytes. Expression measured by real-time RT-PCR and normalised to GAPDH White bars, CD4+CD25-; black bars, Tregs. (B) Relative expression of TCF expression in wild-type and SAP-1-/- Tregs as measured by real-time RT-PCR shows no compensatory increase in Elk-1 or Net mRNA upon loss of SAP-1 expression. White bars, wild-type; black bars, SAP-1-/-. (C) Gel mobility shift assay performed with c-Fos serum response element probe on peripheral CD4+CD25- or CD4+CD25+ T cell extract with or without PDBu stimulation, in the presence of recombinant SRF DNA binding domain. MEK inhibitor UO126 or anti-SAP-1 antibody were added to the reactions where indicated. Identities of the complexes are indicated. (D) p-ERK levels measured by western blot (top panels) and intracellular staining (bottom panel) upon TCR activation by α-CD3 crosslinking of peripheral and thymic Tregs. Intracellular staining: grey shaded area, unactivated; grey lines, α-CD3 crosslinking for 2mins dark grey - WT CD4+CD25+ thymocytes, light grey SAP-1-/- CD4+CD25+ thymocytes. (E) Egr-1 mRNA induction upon TCR activation measured by real-time RT-PCR and normalised to HPRT. (F) Egr-1 protein levels measured by intracellular staining. Top panel, α-CD3 activation of CD4+CD25- thymocytes (4hrs); middle panel, α-CD3 activation of CD4+CD25+ thymocytes (4hrs); bottom panel, overnight stimulation of CD4+CD25+ thymocytes with α-CD3, APCs and IL-2.
