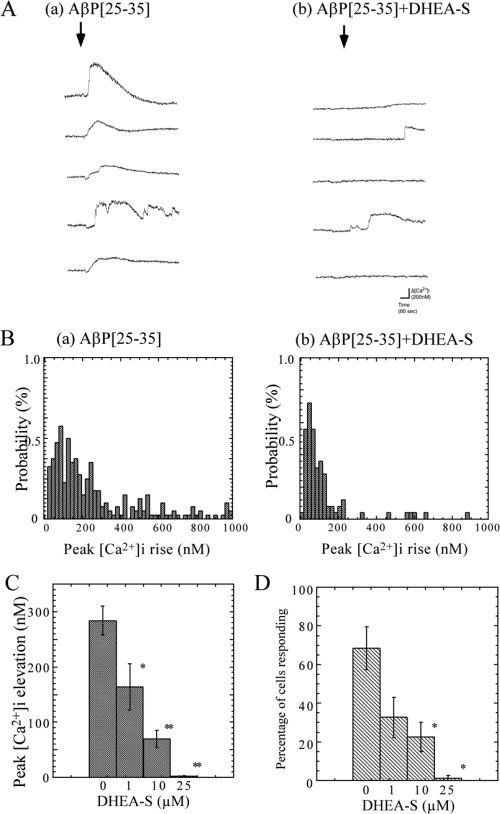
Figure 4.
Effects of DHEA-S on AβP-induced [Ca2+]i increase. A. Responses to AβP with or without DHEA-S pretreatment. After a 20-min incubation period at 37 °C with (b) or without (a) DHEA-S (10 μM), cultured hippocampal neurons (35 DIV) were exposed to 20 μM AβP[25–35]. Five typical traces of temporal changes in [Ca2+]i 2 min before and 5 min after the exposure in the same view field are shown. B. Frequency histograms of extent of [Ca2+]i increase with or without DHEA-S pretreatment. The vertical axes represent the percentage of neurons responding to AβP, and the horizontal axes represent the amplitude of the peak [Ca2+]i increase (bin = 20 nM). C. Dose-dependent effects of DHEA-S pretreatment on average [Ca2+]i increase. After a 20-min incubation period at 37 °C with various DHEA-S concentrations, the average increase in [Ca2+]i within 5 min of exposure to 20 μM AβP[25–35] was determined in hippocampal neurons cultured for 35 DIV from histograms in (B). As a control, the same DMSO concentration (0.5%) was added to the cultured neurons by the same protocol. Data are expressed as mean ± SEM, n = 250. * p < 0.05, ** p < 0.001. D. Effects of DHEA-S pretreatment on percentage of cells responding to AβP. The percentage of neurons responding to AβP[25–35] under the same conditions as those in (A) after pretreatment with various DHEA-S concentrations is analyzed from histograms in (B). Data are expressed as mean ± SEM, n = 5, * p < 0.05.

