
Figure 1.
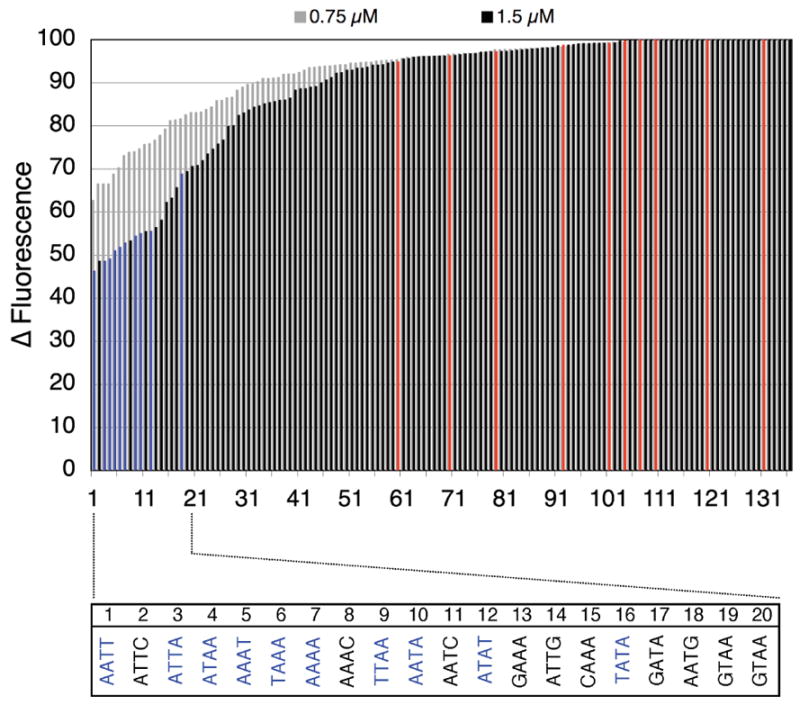
HT-FID analysis of RT29. Blue bars represent A/T-only 4-base pair cassette sequences while the red bars represent G/C-only 4 base pair cassette sequences.
Official websites use .gov
A
.gov website belongs to an official
government organization in the United States.
Secure .gov websites use HTTPS
A lock (
) or https:// means you've safely
connected to the .gov website. Share sensitive
information only on official, secure websites.
HT-FID analysis of RT29. Blue bars represent A/T-only 4-base pair cassette sequences while the red bars represent G/C-only 4 base pair cassette sequences.