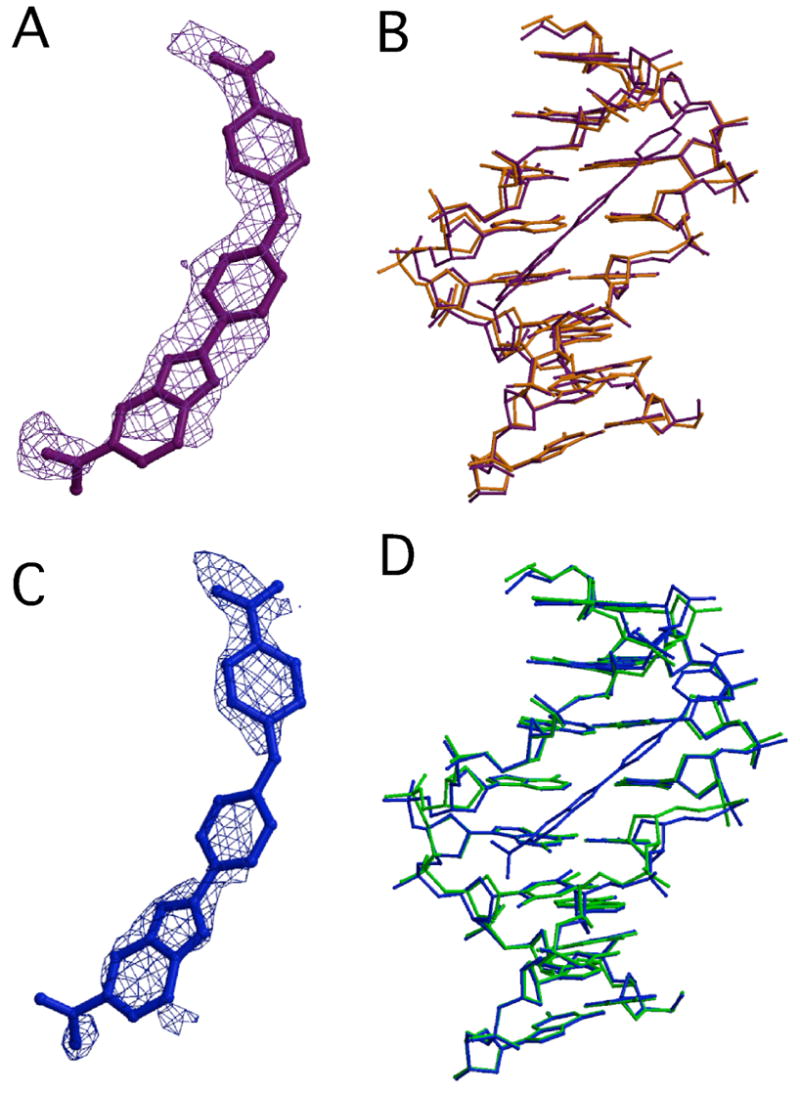
Figure 3.

(A) Final 2Fo-Fc map of RT29 density contoured at 1 σ is shown in a violet cage rendering superimposed on the final RT29 model bound to AATT (purple). (B) Final models of AATT DNA in the presence (purple) and absence (orange) of RT29 (rmsd = 0.38 Å, superimposed in O based on C1’ atoms of all 8 bp). (C) Final 2Fo-Fc map of RT29 density contoured at 1 σ is shown in a blue cage rendering superimposed on the final RT29 model bound to ATTC (blue). (D) Superimposed final models of ATTC DNA in the presence (blue) and absence (green) of RT29 (rmsd = 0.34 Å, superimposed in O based on C1’ atoms of all 8 bp).
