
Figure 6.
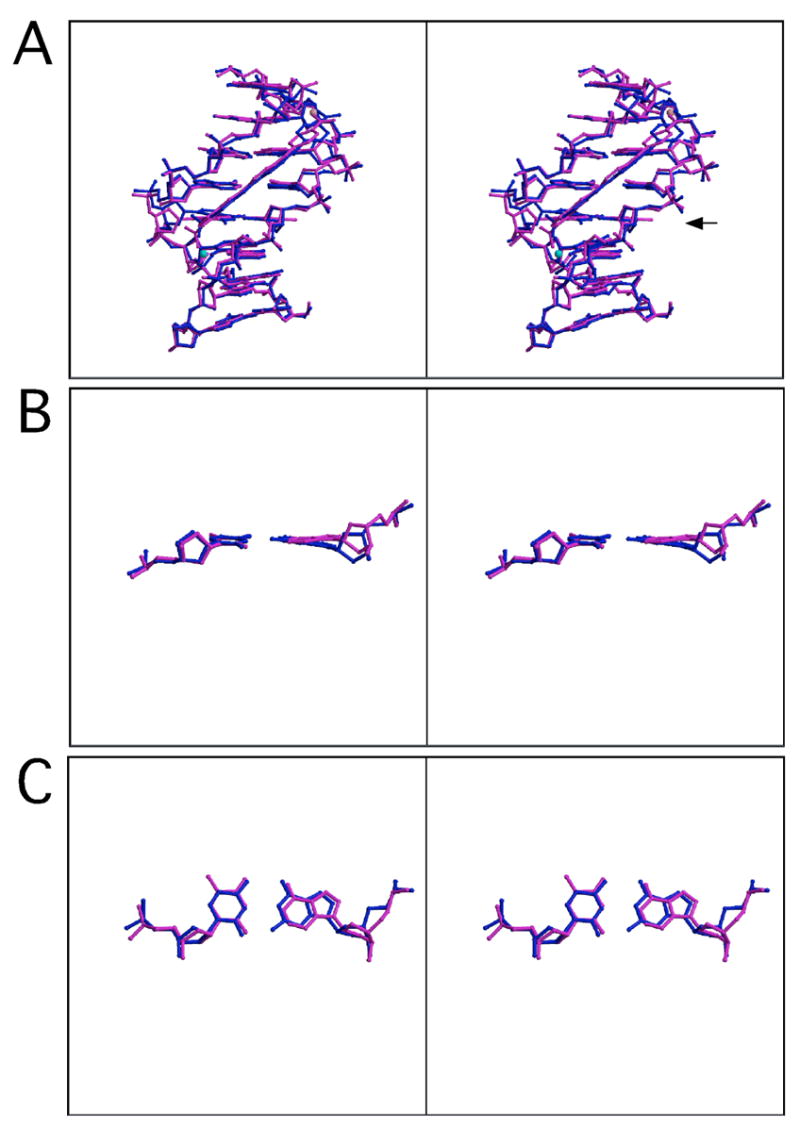
(A) Stereodiagram of structures of DNA bound to RT29 (AATT, magenta; ATTC, blue) superimposed in O using C1’ of all 8 bp (rmsd = 0.42 Å). (B) and (C) Stereodiagrams of A4-T13 (magenta) and G4-C13 (blue) base pairs from superimposed DNA structures. There is a water molecule associated with each complex represented as a cyan sphere for the ATTC structure and a pink sphere for the AATT structure. The view in (B) is rotated ~ 160° from the view in (A) to allow an edge on view of the base pairs. The view in (C) is rotated ~ 90° from the view in (B).