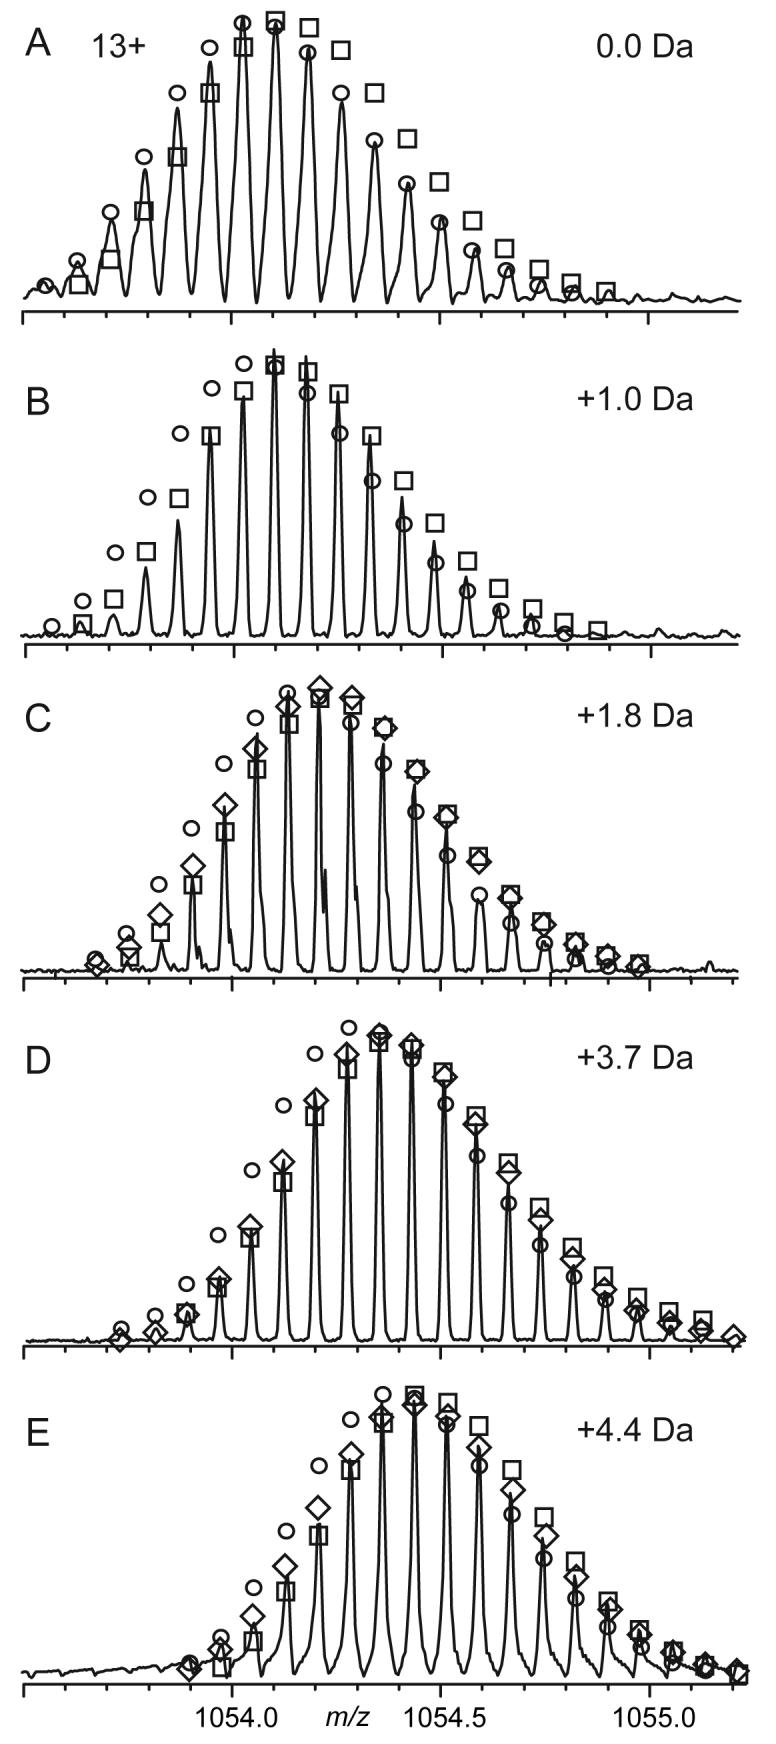
FIGURE 1.

ESI spectra of RNase, 13+ molecular ions: (A) untreated, and (B-E) after deamidation that caused a mass increase of 1.0, 1.8, 3.7, and 4.4 Da. ○, □: best fit of the theoretical abundance distribution corresponding to the protein deamidated at n and n+1 sites, respectively. ◇: best fit of the indicated fractional number of deamidations.
