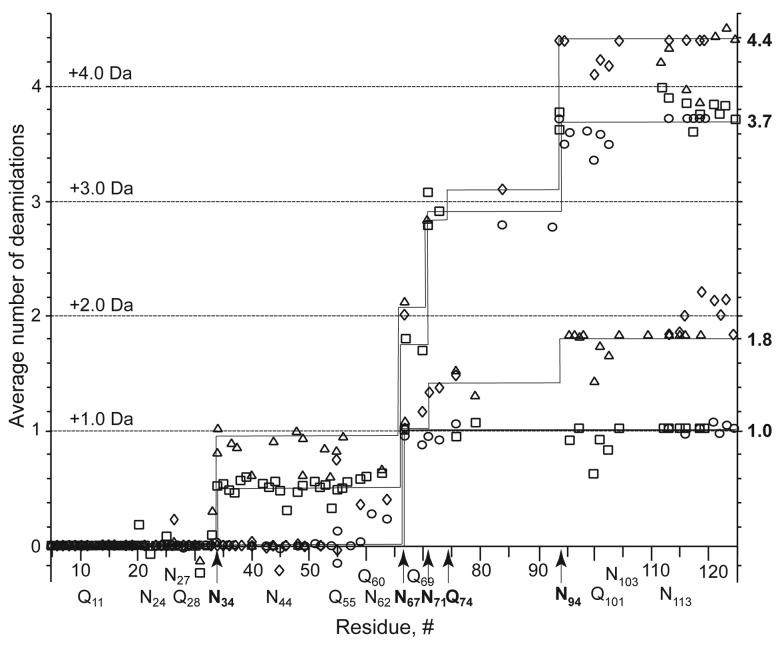
FIGURE 4.
Deamidation map of the RNAse sequence from the values of Figures 2 and 3. Symbols for (b or c) and (y or z·) fragment ions, respectively: 1.0 deamidations: ○, □. 1.8: ◇, △. 3.7: □, ○. 4.4: △, ◇. The deamidation value shown for a y or z· (C-terminal) ion represents the difference between its observed value and that of its parent ions.

