
Figure 3. T-HEp3 and D-HEp3 cell resistance to chemotherapy-induced apoptosis.
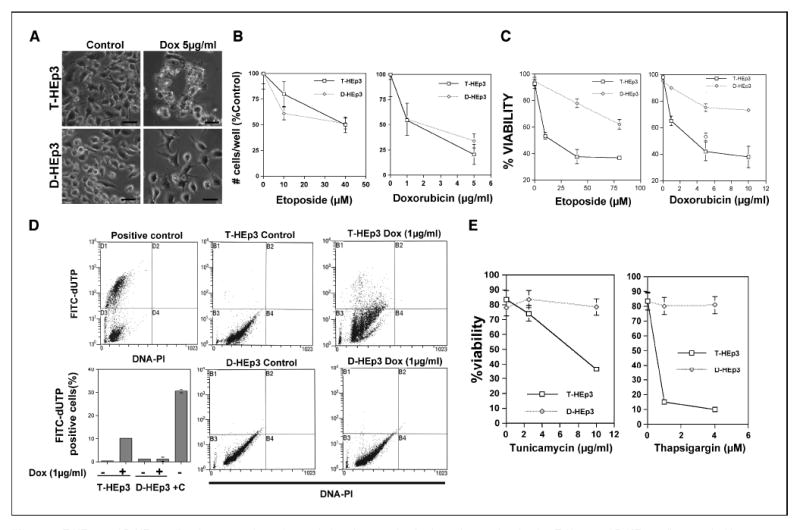
A, photomicrographs showing T-Hep3 and D-HEp3 cells treated with or without doxorubicin (Dox) for 30 hours in serum containing media. Bar, 160 μm. B, T-HEp3 and D-HEp3 cells treated with or without the indicated concentrations of doxorubicin or etoposide for 30 hours in serum containing media were detached with trypsin/EDTA and counted using a Coulter counter. C, cell viability assays using trypan blue exclusion test for T-HEp3 (□), D-HEp3 (◇) treated with or without the indicated concentrations of doxorubicin or etoposide for 30 hours. D, quantitation of DNA breaks as measured using the TUNEL assay Apo-Direct kit. Cells were counterstained with propidium iodide (PI) to detect all DNA content, and a positive control provided by the kit is shown in the top left dot plot. Apoptotic cells with labeled DNA breaks accumulate in the top left quadrant (D1, positive control or B1 in samples). Points, mean of % FITC-dUTP–positive cells in each sample (bottom left); bars, SD. +C, positive control. E, T-HEp3 and D-HEp3 cells were treated with the indicated concentrations of tunicamycin or thapsigargin for 16 hours, and the percentage of viable cells was determined by trypan blue exclusion assay as in (B).