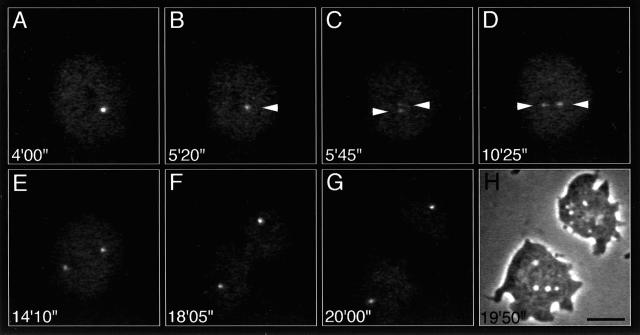
Figure 1.
Centrosome behavior during mitosis visualized by γ-tub–GFP in a D. discoideum ameba. (A and B) Prophase; (C and D) prometaphase; (E) metaphase; (F) anaphase; (G) telophase. Note that the brightness of the centrosome decreases before its separation and reincreases after separation. The times are in minutes and seconds. (H) Phase contrast image corresponding to panel G. Scale bar, 10 μm.

