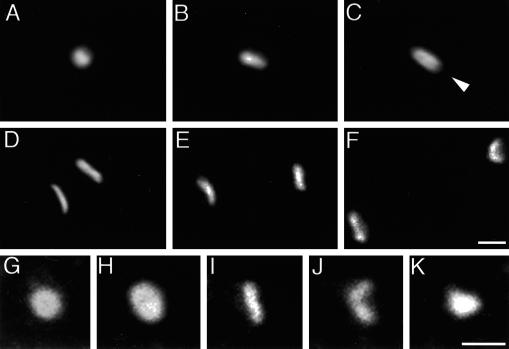
Figure 3.
Conventional (A–C) and confocal (D–K) microscopy images of fixed cells illustrating the shape changes of mitotic centrosomes in cells expressing γ-tub–GFP. (A) Interphase; (B) prophase; (C) prophase/prometaphase; arrowhead in panel C indicates a dark zone along the long axis of the centrosome. (D–F) Stacks of 40 optical sections of 40 nm each: (D) metaphase; (E) anaphase; (F) telophase. (G–K) Single optical sections through centrosomes at higher magnification: (G) interphase; (H) early prophase; (I) metaphase; (J) anaphase; (K) late telophase. Note the increase in size from interphase to prophase (G and H) and the curvature in the anaphase centrosome (J). The cells shown here were also stained with DAPI (not shown) to assess the phases of mitosis. Scale bar, 1 μm.

