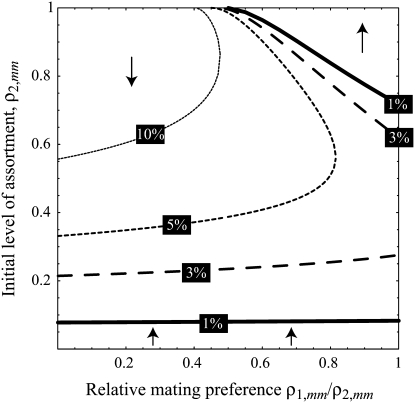
Figure 5.—
Parameter space in which modifiers increasing the level of assortative mating are able to invade. The results of a local stability analysis for the preference-based model without costs are shown. Arrows indicate whether a modifier allele M that increases the level of assortative mating (by any amount) is able to invade an equilibrium with m fixed and  . The curves specify the parameter combinations at which
  , which coincide with when
  . Each curve is associated with a particular percentage by which natural selection favors homozygotes over heterozygotes, at the equilibrium before the M allele is introduced (solid boxes). Only when natural selection is weak (natural selection favors homozygotes by ∼ ≤1%) are the results similar to the QLE results summarized in Figure 4. The vertical axis gives the initial level of assortment
  , while the horizontal axis measures how much females dislike males that differ by one allele relative to those that differ by two alleles,
  .
.

