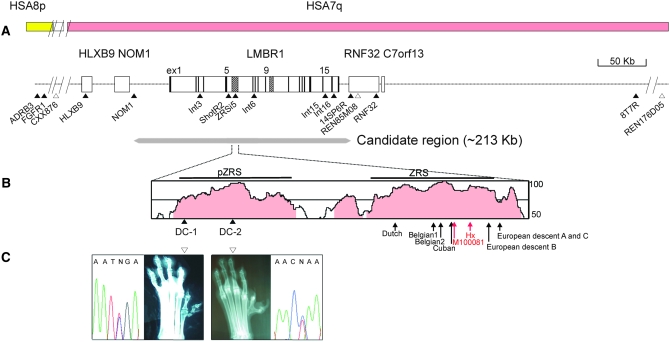
Figure 1.—
Genomic analysis of the PPD locus on CFA16. (A) The genomic structure around the MCS regions of the LMBR1 gene. The SNPs (solid triangles) and microsatellites (open triangles) are indicated below. The black bar and shaded regions within the LMBR1 gene represent exon and MCS regions, respectively. The yellow and pink bars represent human syntenic regions on HSA8p and HSA7q. The deduced candidate region (213 kb) around the LMBR1 gene for PPD is designated below. (B) The highly conserved region between human and dog, analyzed using VISTA (http://genome.lbl.gov/vista), is presented. The region with >50% identity analyzed with windows of 100 bp appears on the plot, while those >75% are shaded in pink. The identified PPD mutations, DC-1 and DC-2, are presented (solid triangles). The red and black arrows indicate the sites of two mouse mutations, Hx-G/A and M100081-A/G, and six human PPD mutations: Dutch-C/G (105 bp from 5′-ZRS), Belgian1-A/T (305), Belgian2-T/C (323), Cuban-G/A (404), family B-C/G (621), and families A and C-A/G (740) from northern European descent (Lettice et al. 2003; Gurnett et al. 2007). The phenotypic patterns of preaxial polydactyly are indicated below. (C) A sequence electropherogram of DC-1 (Sapsaree) and DC-2 (Great Pyrenees) mutations read in the reverse direction are shown with hind foot radiographs.

