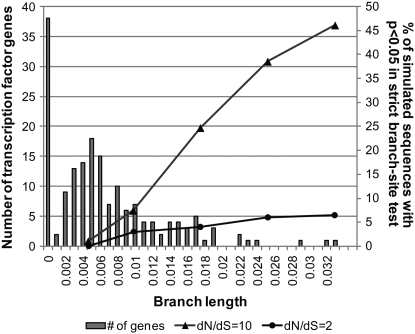
Figure 3.—
Prediction of positive selection across a range of branch lengths representative of human genes. The distribution of the human branch length for the 175 transcription factor genes is shown (columns). The secondary axis represents the percentage of simulated alignment sets that were correctly classified as positively selected in the strict branch-site test when dN/dS on the foreground lineage was set at 2 (circles) or 10 (triangles).

