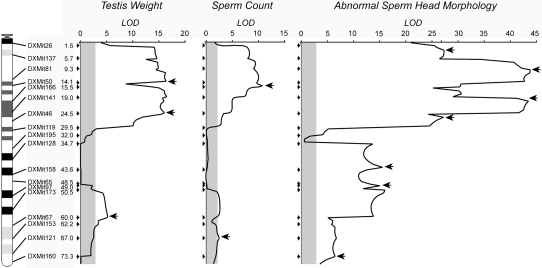
Figure 5.—
Results for QTL mapping of hybrid male sterility phenotypes in experiment 1. LOD scores are based on CIM analysis of testis weight, sperm count, and the proportion of abnormal sperm in males from the N6, N7, and N8 generations. The physical location, identity, and genetic position (cM) of screened markers are given along the left margin. The significance threshold (α = 0.05) for each trait is shaded and is based on 1000 permutations. Arrows indicate the position of individual QTL that remained significant in MIM models.

