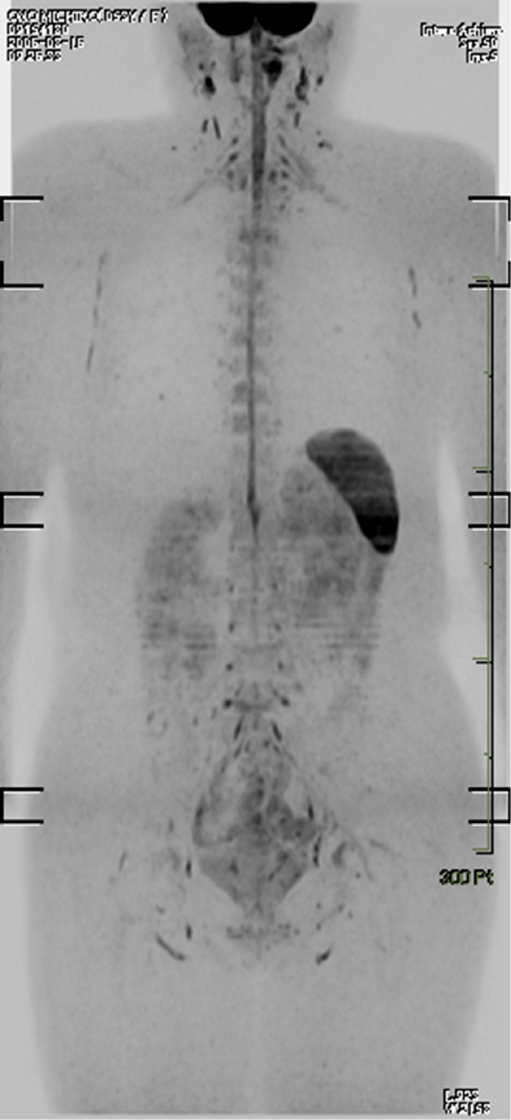
Fig. 5.
Coronal maximum intensity projection DWIBS image (inverted black-and-white gray scale) of a healthy 53-year-old female volunteer. Normal high signal intensity (black on this image) can be seen in the brain, spinal cord, nerves of the brachial and lumbosacral plexus, vertebral bone marrow, endometrium, spleen, and cervical, axillary, pelvic, and inguinal lymph nodes

