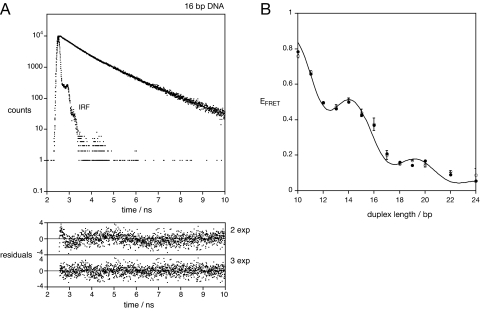
Fig. 4.
The existence of an unstacked fraction of fluorophore. (A) Time-resolved fluorescent lifetime analysis of Cy3 attached to double-stranded DNA. Fluorescent decay curve for Cy3 attached to a 16-bp DNA duplex, showing the experimental data and the instrument response function (IRF), and the fit to three exponential functions (line). Plots of weighted residuals for fitting the data to two (χ2 = 1.33) or three (χ2 = 1.06) exponential functions are shown below. (B) On the basis of this analysis, the EFRET data for the DNA duplexes were simulated by using a model in which the fraction of the fluorophores indicated by the fluorescent lifetime analysis was given free mobility with κ2 = 2/3, whereas the remaining fluorophore was constrained to undergo lateral motion with a distribution of species as before. The simulation (line) has been plotted with the experimental data (points) obtained from ensemble (filled circles) and single-molecule (open circles) experiments. Both datasets were found to be well described by a simulation in which 31% of the molecules had a mobile fluorophore extended by a further 7Å, and the remaining fraction of stacked fluorophore underwent lateral motion with a Gaussian half-width of 42°. The fluorescent quantum yield for Cy3 was 0.30 (17), and the refractive index 1.33. Standard B form geometry of the DNA helix was used.

