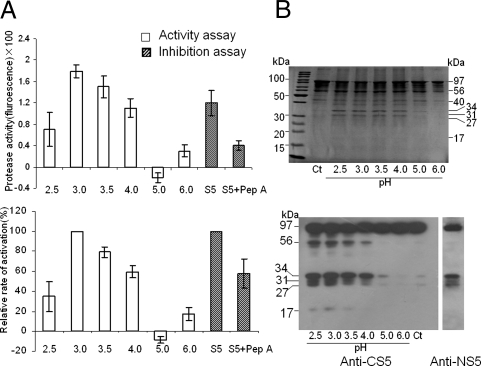
Fig. 3.
In vitro assay of protease activity of S5. (A) Absolute activity measured as the spectrophotometer reading with that of water control set to zero (Top), and relative activity by using the highest activity (pH 3.0) as the reference (Bottom). The open bars are the readings of protease activity assays and the shaded bars are the readings of the pepstatin inhibition assays. Error bars = 1 SEM. (B) SDS-PAGE showing the protein bands of the autolytic products in a series of pH buffers (Top), and immunoblot confirmation of the S5 autolytic products by using Anti-CS5 and Anti-NS5 as the probes (Bottom). The lanes marked Ct are the controls. The molecular weight on the right side of the top section and the left side of the bottom section was estimated on the basis of size markers (as shown on the left side of the top section).

