Fig. 1.
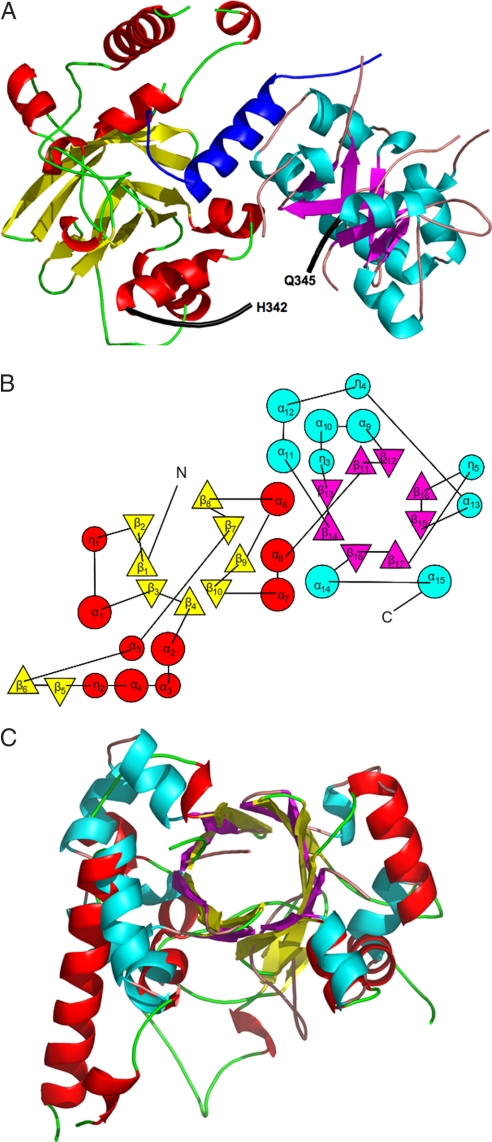
The VirE2 fold. (A) Ribbon representation of VirE1–VirE2 complex [created with PyMol (51)]. The helix of VirE1 is shown in blue. The N-terminal domain of VirE2 is depicted in red for α-helices and yellow for β-strands, and the C-terminal domain is shown in cyan for α-helices and magenta for β strands. Both folded domains construct TIM barrels with a unique topology defining the VirE2 fold. The interdomain linker (residues 337–346) is shown as a thick black line for which no electron density was observed for residues N343 and K344. (B) A topology representation [obtained by using TOPS (52)] of the VirE2 fold; β-strands are represented by triangles and α-helices by circles, with colors as in A. (C) Superposition of the N- and C-terminal domains of VirE2 showing that they have the same fold despite their low sequence homology.

