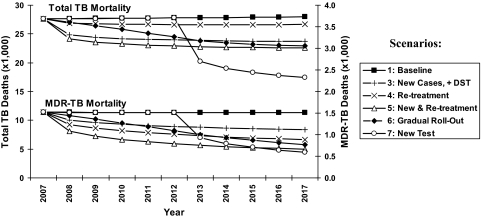
Fig. 2.
Annual TB and MDR-TB mortality with expanded culture and DST. Projected annual deaths under six scenarios of culture/DST access (see Materials and Methods and Table 1). Total TB mortality, per year, is shown by the upper set of lines corresponding to the left vertical axis, and MDR-TB mortality is shown by the lower set of lines corresponding to the right vertical axis. Cumulative 10-year impact corresponds to the area between the baseline curve (squares) and the curve corresponding to a given scenario. Scenario 2 is not shown because of overlap with scenario 3 (total TB mortality) and scenario 1 (MDR-TB mortality), and scenario 8 is not shown because of overlap with scenario 5. MDR-TB excludes XDR-TB.

