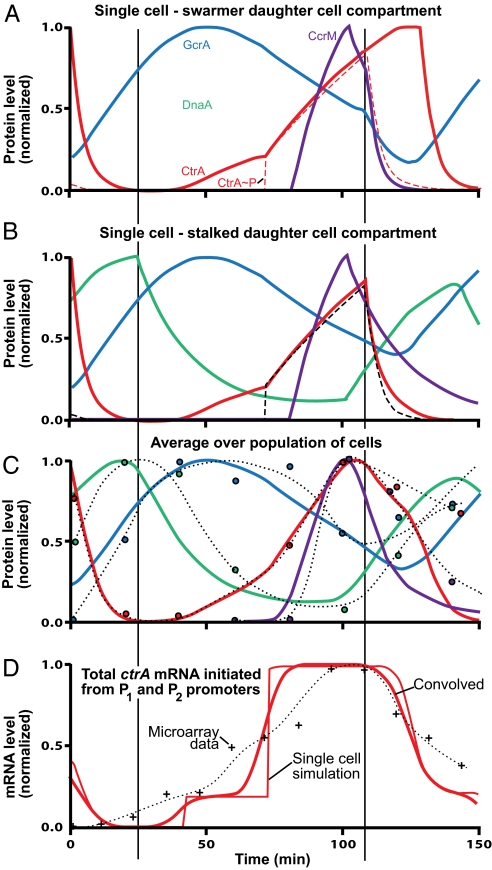
Fig. 2.
Simulation of protein levels (normalized) during cell-cycle progression. A and B show predicted (normalized) levels of the master regulatory proteins (Fig. 1) tracked into the swarmer and stalked cell compartments, respectively, at the single-cell level. After inner membrane compartmentalization at ≈117 min, protein concentration levels diverge in the stalked and swarmer daughter cell compartments. (C) Circles: observed protein levels in synchronized cells (quantified Western blots, Fig. 1B). (The dotted lines are continuous approximations of the experimental levels.) Curves: simulated protein levels made comparable with experimental observations by averaging results in A and B and convolving with a Gaussian distribution to approximate random variation around an average in different cell's progression through the cell cycle. The errors in the experimental values are approximately ±10% of the peak value. Loss of synchrony degrades experimental data in predivisional cell. (D) +, observed ctrA mRNA levels from Affymetrix microarray assays (20).

