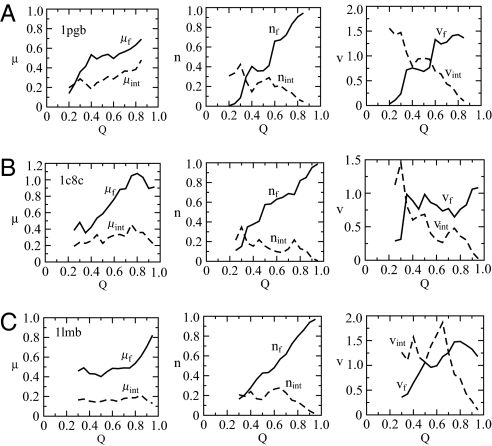
Fig. 4.
Examples of three folding patterns. Patterns A–C correspond to (A–C), respectively. Column 1 shows the mean packing fraction in folded core (μf, solid line) and interface region (μint, dashed line) as function of Q; column 2 shows the number of particles in the folded core (normalized by the chain length, nf, solid line), and interface region (nint, dashed line) as a function of Q; column 3 shows the volume of folded core (normalized by the volume at native state, vf, solid line) and interface region (vint, dashed line) as a function of Q.

