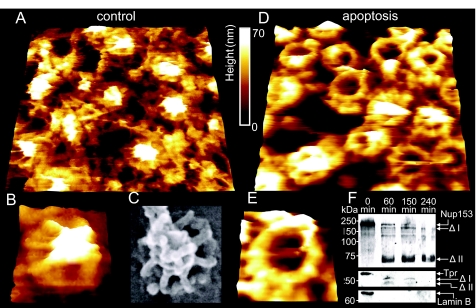
Fig. 3.
Nanoscopic changes of the nucleoplasmic side of the NE 2.5 h after injection of cytochrome c or solvent, respectively, into the cytosol. (A) 730 × 730-nm AFM image of the nucleoplasmic side of the NE (control). (B) A magnification of (A), displaying a single NPC with intact nuclear basket. (C) SEM image of a single NPC (likewise from the nucleoplasmic side) for comparison (image taken from ref. 38, with permission of the Nature Publishing Group) (D) 730 × 730-nm AFM image of the nucleoplasmic side of an apoptotic NE. (E) A magnification of (D), displaying a single NPC bearing the remaining anchoring structures of the basket. (F) Western blots showing the degradation of Nup153 and Tpr, as well as a blot showing the degradation or removal of lamin B from the NE. Time points after cytochrome c injection are indicated, and putative degradation products are marked with a Δ.

