Figure 7.
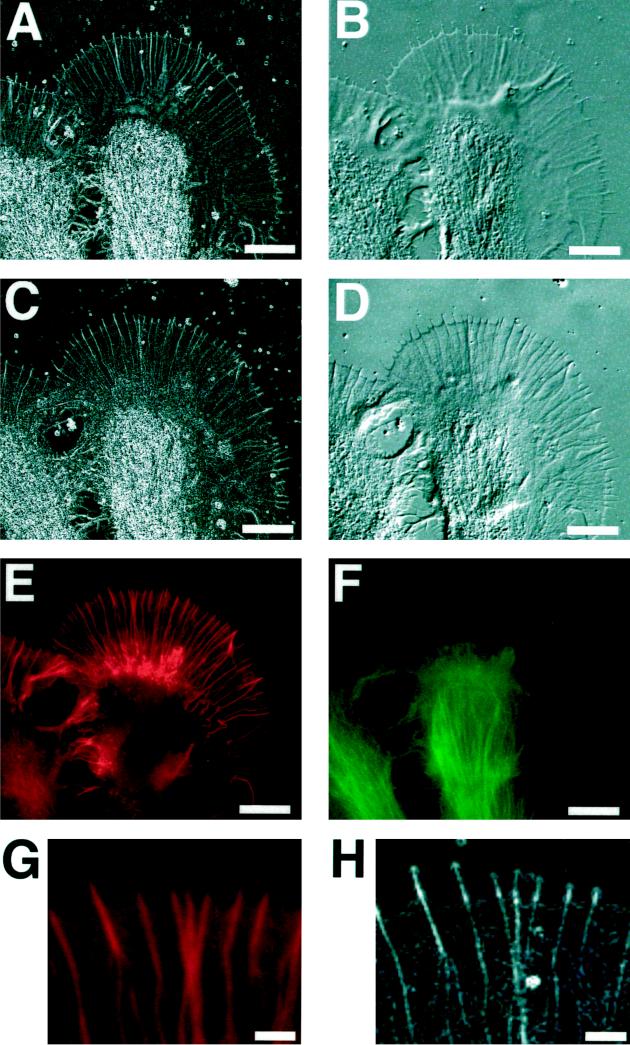
Growth cone of an Aplysia bag cell neuron that was fixed, double-labeled for f-actin and microtubules, and imaged with the Pol-Scope, with differential interference contrast, and with fluorescence microscopy. (A) Retardance magnitude image of living growth cone shortly before fixation, imaged with the Pol-Scope. (B) Living growth cone imaged by DIC. (C) Fixed growth cone imaged with the Pol-Scope. (D) Fixed growth cone in DIC (bias retardance inverted compared with that in B). (E) Rhodamine-phalloidin stain in fixed growth cone indicating the distribution of filamentous actin. (F) Fluorescein-tagged tubulin secondary antibody indicating the distribution of microtubules in the fixed growth cone. (G and H) Magnified rhodamine fluorescence and Pol-Scope images, respectively, of the same area in the peripheral lamellar domain near the leading edge. The fluorescence images reveal the radial birefringent fibers and the weakly birefringent areas between fibers in the peripheral domain as f-actin based, whereas the birefringence in the central domain is attributable in large part to microtubules that are absent from the peripheral domain. Note in the DIC images the orientation-dependent contrast of radial fibers because of optical shear, whereas contrast variation in the Pol-Scope images of radial fibers is caused by the variation in the number of actin filaments in the bundles. In birefringence images, a retardance of 0.8 nm, or higher, is displayed as white. Bars: A–F, 10 μm; G and H, 2 μm.

