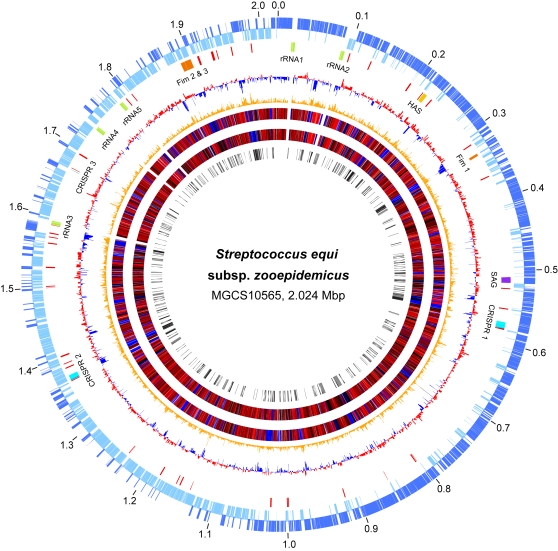
Figure 1. Genome atlas.
Data from outermost-to-innermost circles are in the following order. Genome size in megabase pairs (circle 1). Annotated CDSs encoded on the forward (circle 2) and reverse (circle 3) chromosomal strands are in dark and light blue respectively. Reference landmarks (circle 4) as labeled are, ribsomal RNAs in green, fimbrial operons in orange, hyaluronic acid capsule synthesis loci in gold, CRISPR/CAS phage immunity loci in light blue, streptolysin S (sag) operon in purple, and ISs/transposons in red. CDS percent G+C content (circle 5) with greater and lesser than average in red and blue, respectively. Net divergence of CDS dinucleotide composition (circle 6) from the average is in orange. TBLASTN comparison of gene content with nephritogenic GAS serotype M12 strain MGAS2096 (circle 7), with high similarity in red and low in and blue. TBLASTN comparison of gene content with other sequenced streptococcal species (circle 8), with high similarity in red and low in blue. Species-specific gene content (circle 9), products not present in the other streptococcal species are in black and products sharing less than 50% amino acid identity with the most similar streptococcal homologue are in gray.

