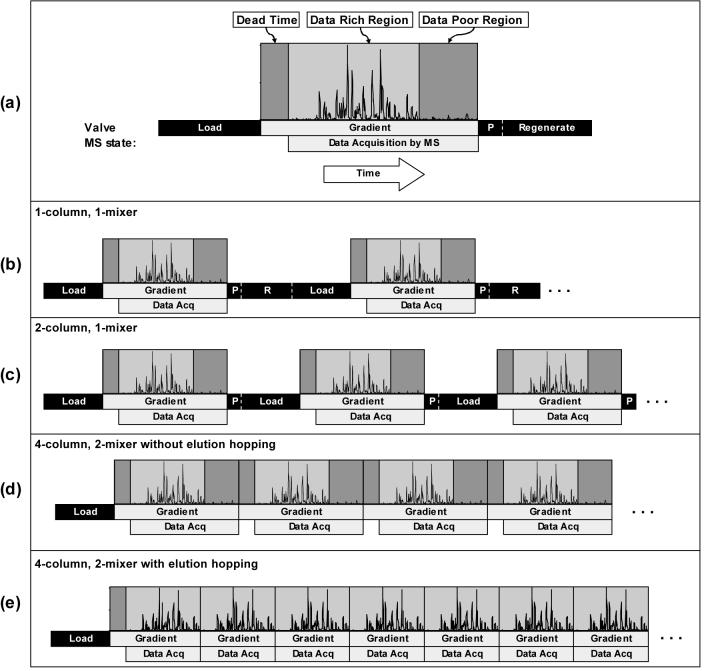
Figure 2.
Duty cycle comparison of various single- and multi-column LC systems with all times drawn to scale for LC configuration 3 in Table 1 except for the data rich region and data poor region which are estimates for the chromatogram which is shown. (a) Schematic description of the steps which must be performed for each sample processed on an analytical column. The steps in consecutive analyses on systems that use (b) 1 column and 1 mixer, (c) 2 columns and 1 mixer, (d) 4 columns and 2 mixers with no elution hopping and (e) the same system shown in (d) but with the dead time at the beginning of the gradient elution bypassed or ‘hopped over’ and without acquiring data during the ‘data poor’ region at the end of the gradient elution.

