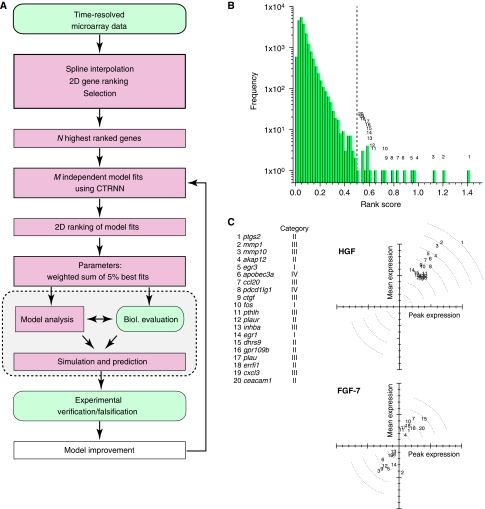
Figure 1.
Identification of genes mediating HGF-induced cellular transition to migration. (A) Workflow of data analysis, inverse modeling and experimental validation. (B) Histogram of rank scores for all 20 188 measured genes after HGF stimulation (cf. Materials and methods). The ranks numbered 1–20 correspond to the 20 highest ranked genes (cf. gene list in (C)). (C) Top: mean and peak fold expression of the 20 top-ranked genes upon HGF stimulation. Bottom: expression of the same genes upon FGF-7 stimulation. Data points were normalized to the maximal mean and peak fold expression of the respective experiments (cf. Materials and methods).

