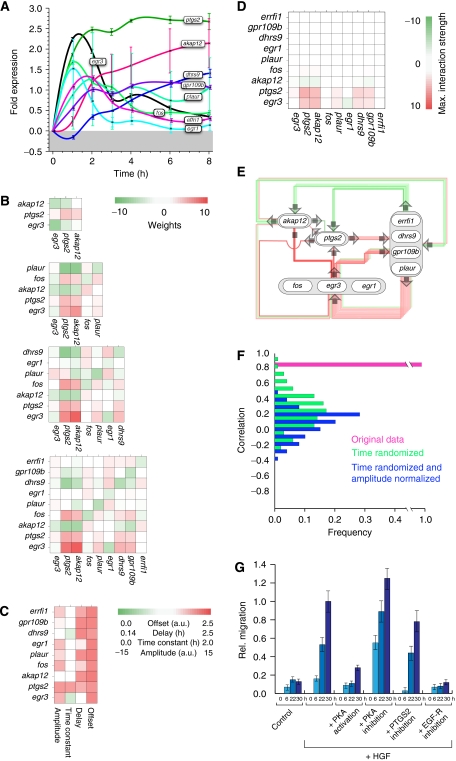
Figure 3.
Gene regulatory network topology of genes mediating HGF-induced migration predicts multiple points of interference. (A) Spline-interpolated gene fold expression time series of all genes considered for the in silico analysis of the nine-node network. Error bars denote the standard deviation of the probe sets' fold expression values for each gene. The minimum error is ±0.08-fold expression, calculated from the mean fold expression of all genes. (B) Interaction weights Wij for the CTRNNs obtained by inverse modeling for networks of size 3, 5, 7 and 9 genes (from top to bottom). (C) Offsets θ, delays Δτ, time constant τ and input amplitudes I for the nine-gene network. The interaction weights (B) and the parameter values (C) are color-coded. Note that parameter values are mostly robust with increasing network size. (D) Maximal interaction strengths Wijmax (equation (6)) for the nine-gene network shown in (E). (E) Network diagram for a nine-gene network with interaction weights taken from (B). Note that only the strongest interactions are drawn for better illustration. (F) Histogram of the linear Pearson correlation coefficients of parameter estimates from a nine-gene network using the original (pink), time-randomized (green) and additionally normalized experimental data (blue), having the correlation mean and s.d. values of 0.97/0.01, 0.25/0.24 and 0.13/0.20, respectively (cf. Materials and methods section). (G) Modulation of HGF-induced migration by PKA or EGF-R activity, simultaneous to HGF pulse. To induce a migratory response, HaCaT cells were incubated (30 h) with or without 10 ng/ml recombinant human HGF. PKA activity was modulated by the addition of 1 μM H-89 (Calbiochem) or 200 μM 8-(4-chlorophenylthio)adenosine 3′,5′-cyclic monophosphate sodium salt (Sigma). Inhibition of PKA by the addition of 10 μM myristoylated PKI (14–22) amide, cell-permeable PKA inhibitor (Biomol), gave rise to similar results (data not shown). EGF-R activity was blocked by the addition of 1 μM GW2974 (Sigma). Error bars denote ±s.d. of the mean migration distance from three independent experiments.

