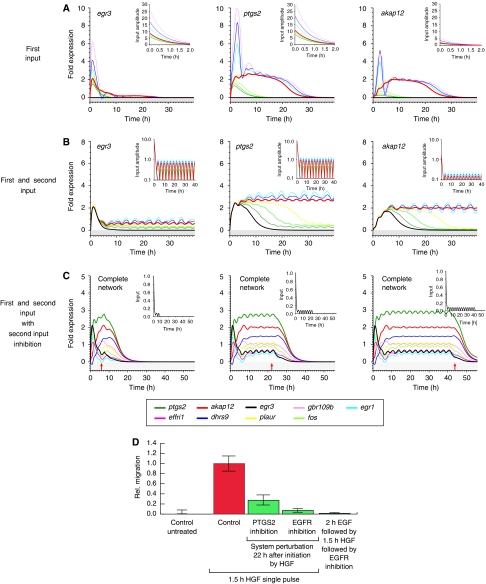
Figure 4.
Sustained migration depends on a second input mediated by the EGF receptor. System response to varied input strengths and shapes is shown. (A) System response to increasing HGF input strength. Input functions are depicted in the small insets. The learned maximal input amplitudes are scaled with the factors {0.0, 0.7, 0.8, 0.9, 1.0, 1.5, 2.0, 3.0} from dark green to pink. (B) System response to a combined initial HGF input and subsequent second periodic input. Simulations were performed with a nine-gene network. The ratio of maximal input amplitudes between the first and the second input increases from 0.0 (black) via 0.04, 0.06, 0.07, 0.08 and 0.1 to 0.12 (purple). Results in (A, B) are shown for egr3 (left), ptgs2 (middle) and akap12 (right). (C) Blocking the second, periodic input at (I) T=7.5 h, (II) T=22 h and (III) T=42.5 h. The red arrows denote the time point of blocking. A sample input function normalized to one is shown in the small insets. (D) Relative migration upon EGF-R blocking or PTGS-2 inhibition 22 h after HGF stimulation. HaCaT cells were stimulated for 1.5 h with 10 ng/ml recombinant human HGF. Cells were washed extensively and further incubated (30 h). Functional perturbation of PTGS-2 (or EGF-R) activity was introduced by the addition of 50 μM meloxicam (4-hydroxy-2-methyl-N-(5-methyl-2-thiazolyl)-2H-1,2-benzothiazine -2-carbox-amide-1,1-dioxide), 5 μM GW 2974 (Sigma) or 150 nM tyrphostin AG1473 (Biomol) 20.5 h after HGF pulse stimulation to culture media. Migratory response was determined in the time window of 22–30 h beginning with the time point of perturbation. Pretreatment of cells with recombinant EGF for 2 h (1 ng/ml) before HGF stimulation is not able to replace EGF-R activity directly blocked after HGF stimulation. Error bars denote ±s.d. of the mean migration distance from three independent experiments.

