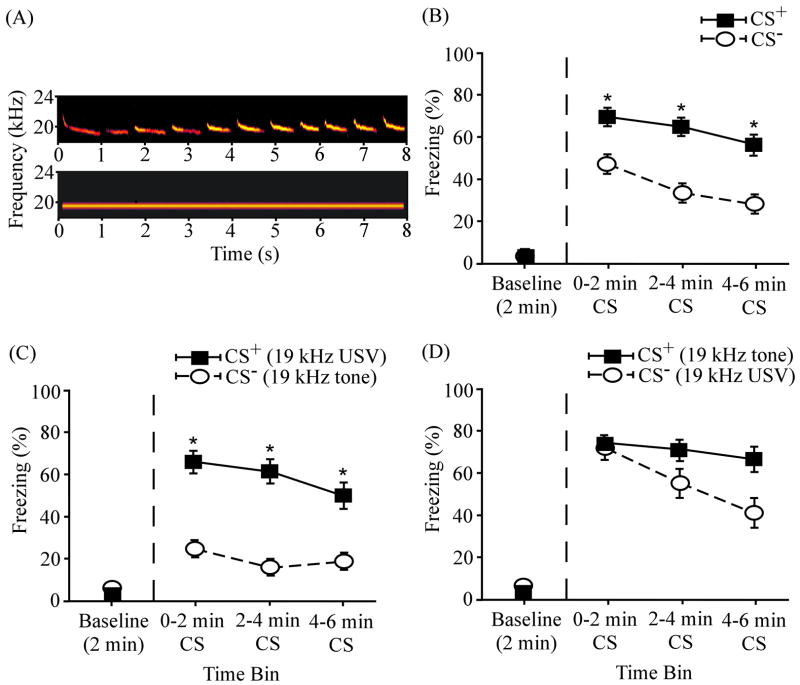
Figure 3.
Differential fear conditioning to a 19 kHz USV and a 19 kHz continuous tone. (A) Spectrograms of the 19 kHz USV (top) and the 19 kHz continuous tone (bottom). (B) Overall mean percentage of time spent freezing to the CS+ and the CS− (N = 24) as a function of time. (C) Mean percent freezing among the subset of subjects (n = 12) that received the 19 kHz USV (part A, top) as the CS+ and 19 kHz continuous tone (part A, bottom) as the CS−. (D) Mean percent freezing among subjects (n = 12) that received the 19 kHz continuous tone as the CS+ and 19 kHz USV as the CS−. The baseline level of freezing (before the CS onset) is plotted on the left of the vertical dashed line. Asterisks (*) denote significant differences between CS+ and CS−. Error bars represent ± 1 SE.

