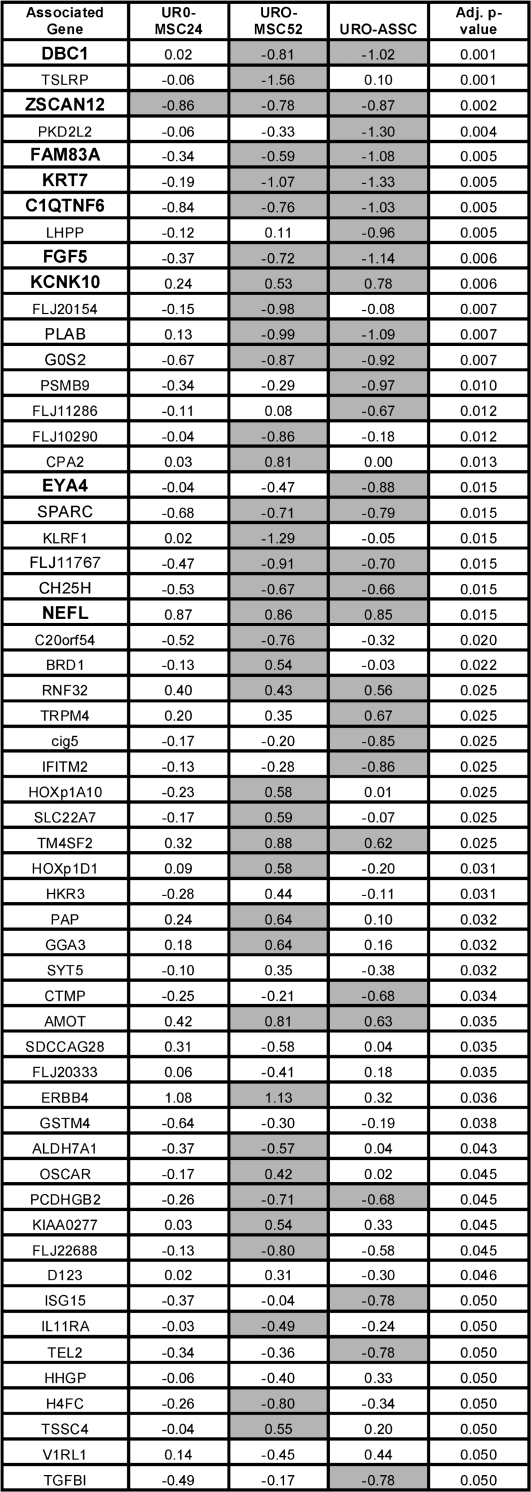
Fig. 2.
Arsenicals selectively alter histone H3 acetylation. Associated gene names of the significantly affected promoters are shown with promoters validated by real-time PCR shown in bold. Values represent log 2 ratios of each cell line derivative relative to UROtsa. Negative values are representative of hypoacetylated elements, whereas positive values represent hyperacetylated promoters. Promoters are sorted by adjusted P-value relative to differences between all three treated cell lines and UROtsa. All changes represented as significant for that particular cell line when compared with UROtsa (adjusted P-value < 0.05) are shaded. Adjusted P-values were calculated according to the methods described by Benjamini et al. (40). For a complete list of promoters exhibiting altered histone acetylation, refer to supplementary Figure 1 (available at Carcinogenesis Online).

