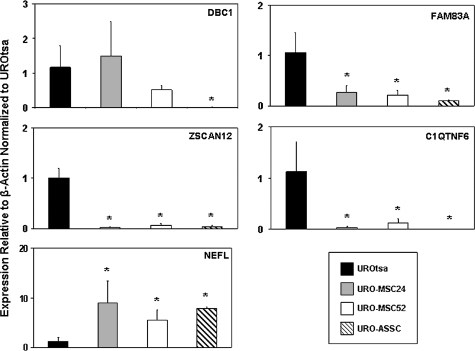
Fig. 4.
Gene expression levels correlate with changes in histone acetylation. Expression levels were examined for genes that were verified to have differentially acetylated promoters. Quantitative real-time reverse transcription–PCR was performed on three independent samples for each cell line with the average expression value shown. Expression levels presented on the y-axis are relative to β-actin expression and normalized to UROtsa. Error bars are representative of the standard deviation. Changes significantly (P < 0.05) different than UROtsa are indicated by *.

