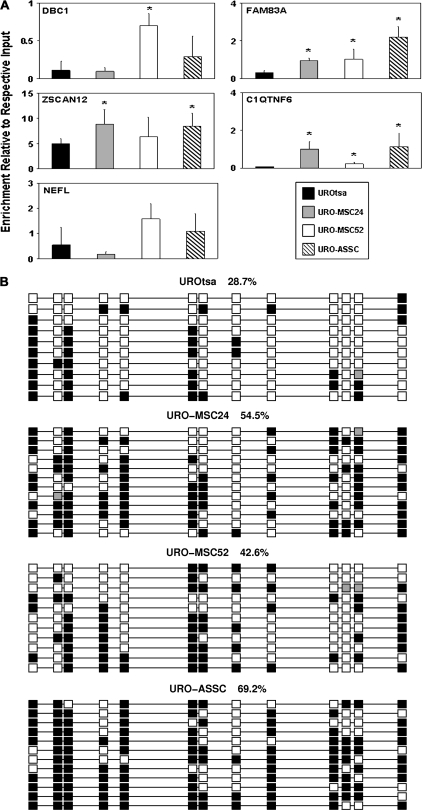
Fig. 5.
DNA methylation is altered in selected gene promoter regions. (A) Relative DNA methylation levels were measured for the same promoters that were found to be hypoacetylated. MeDIP was performed on three independent samples from each cell line and coupled to real-time PCR with the mean enrichment relative to respective input shown along the y-axis. Error bars are representative of the standard deviation. Changes significantly (P < 0.05) different than UROtsa are indicated by *. (B) Sodium bisulfite sequencing confirms MeDIP results. Sodium bisulfite sequencing was performed to examine the DNA methylation levels and pattern in the promoter region of ZSCAN12. Each column represents an individual CpG site, whereas each row is representative of an individual sequenced clone. Spacing is representative of the underlying DNA sequence with the methylation state at each CpG dinucleotide [methylated (filled squares); unmethylated (open squares) and poor sequence (gray squares)] shown. Numbers describe the methylation level for each cell line in the region shown. Clones were sorted for presentation.

