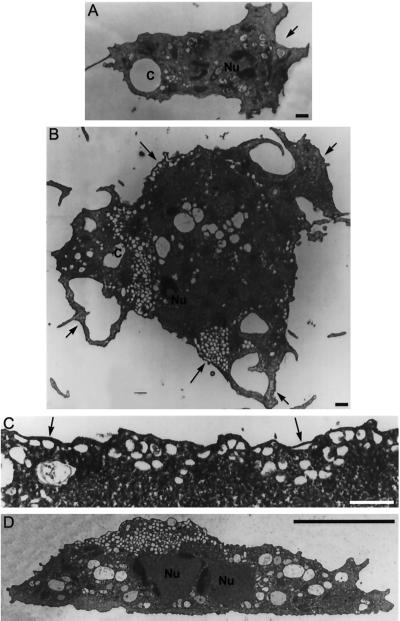
Figure 9.
Representative electron micrographs of wild-type and dymA− cells. Panels A, B, and C represent sections parallel to the surface of attachment. (D) This panel represents a perpendicular section. (A) Wild-type cells are smaller, with single nuclei (Nu) and one or two contractile vacuoles (c) with a few associated small vesicular or tubular profiles. Wild-type cells show a single main extension (arrow), reflecting movement in a particular direction. (B–D) Most dymA− cells are very large. However, due to limitations on illustration size, panels B and D show smaller dymA− cells that nevertheless illustrate the most important features of the dymA− phenotype. In contrast to wild-type cells, dymA− cells extend processes in several directions (short arrows) and display areas with numerous small vesicular profiles (long arrows) that may be sections through discrete vesicles or convoluted tubules. (C) Higher magnification of a region (arrows) showing many vesicular profiles under the cell membrane. Magnification in panels A and B is the same. Bar, 1 μm in panels A–C and 10 μm in panel D.

